


View All Desktop-Certified-Associate Actual Free Exam Questions Jul 09, 2022 Updated
Pass Authentic Tableau Desktop-Certified-Associate with Free Practice Tests and Exam Dumps
For more info read reference
Desktop Certified Associate Exam
NEW QUESTION 53
Connect to the Olympic Athletes data source, find out the average age of players who won at least one gold medal for the country?
- A. 26.72
- B. 26.02
- C. 26.41
- D. 26.33
(Correct)
Answer: D
Explanation:
Drop the Age to the columns and change the aggregation to AVG.
Drop Gold Medals field to filter and select All values ->
Graphical user interface, text, application, email Description automatically generated
Change 1 from 0.
Graphical user interface, application Description automatically generated
NEW QUESTION 54
How to create custom territories on a map?
- A. Select and group locations on a map
- B. Create a territory from a geographic field
- C. By using a background image on a map
- D. Geocode a territory field using another geographic field
Answer: A,B,D
Explanation:
Refer: https://help.tableau.com/current/pro/desktop/en-us/maps_custom_territories.htm
NEW QUESTION 55
Connect to the "Global Superstore" data source and use the Orders table. Find out the group of states(in the US) having the highest sales in 2013?
- A. North Carolina, South Carolina, Virginia
- B. New York, Massachusetts, Rhode Island
- C. California, Idaho, Nevada
- D. Texas, New Mexico, Colorado
Answer: C
Explanation:
Drop the State field to a view, you will get >1k unknown.
Drop the Country to the Filters Shelf and Select the United States, all unknowns should be gone.
Also, drop the Order Date to the Filters Shelf and choose Years as:
Graphical user interface, application Description automatically generated
Check for the Year 2013.
Drop the Sales field to the Label in the Marks card, your view should look like this:
Graphical user interface Description automatically generated with medium confidence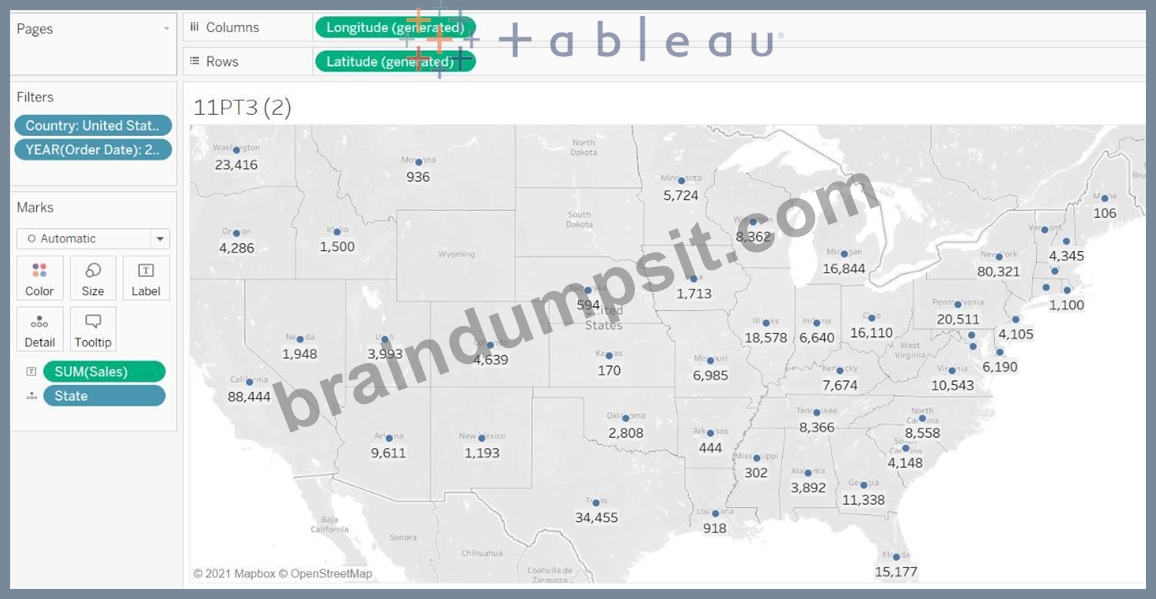
Now use the Lasso Selection tool from the Map tools:
Graphical user interface, diagram Description automatically generated
And create the group of states as per our answer options.
Example - for New York, Massachusetts, Rhode Island, Similarly, do for other 3 options as well.
Map Description automatically generated
Duplicate this worksheet and remove the Latitude and Longitude from the view and drop this new dimension of groups to the view. California, Idaho, Nevada is the right answer.
Graphical user interface, text, application Description automatically generated
NEW QUESTION 56
In a box plot, how we can calculate the length of the Upper whisker?
- A. Upper whisker = (Upper hinge - Lower hinge) + (1.5 * IQR)
- B. Upper whisker = IQR + (1.5 * IQR)
- C. Upper whisker = Lower hinge + (1.5 * IQR)
- D. Upper whisker = Upper hinge + (1.5 * IQR)
Answer: D
Explanation:
Explanation
The upper whiskers extends to 1.5 * IQR

The length of the upper whisker is upper hinge + 1.5 * IQR.
NEW QUESTION 57
In table calculations, partitioning fields define the direction of the calculation.
- A. FALSE
- B. TRUE
Answer: A
Explanation:
Explanation
When you add a table calculation, you must use all dimensions in the level of detail either for partitioning (scoping) or for addressing (direction).
Refer:https://help.tableau.com/current/pro/desktop/enus/
calculations_tablecalculations.htm
NEW QUESTION 58
Connect to the "Global Superstore" data source and use the Orders table. Find out how many new customers were acquired in the year 2014?
- A. 0
- B. 1
- C. 2
- D. 3
Answer: C
Explanation:
Explanation
If customer first order is equal to the order date, then this is the new customer.
Create a calculated field to find the first order date:
Find If the order date is equal to the day of first purchase for that customer, flag that row as a
'New Customer'
Find the unique customers:
Drop the Order date to filter shelf and select the year 2014 to find out the new customer acquired in 2014.
Drop New Customer field to Rows and Unique customer field to Text marks card.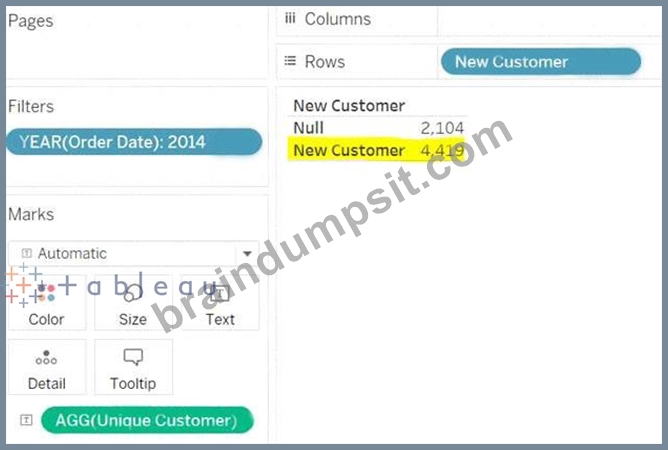
NEW QUESTION 59
Which of the following are forecast quality metrics available in Tableau?
- A. AISE
- B. RMSE
- C. MAPE
- D. MASE
Answer: B,C,D
Explanation:
Explanation
Refer section "Quality Metrics" athttps://help.tableau.com/current/pro/desktop/enus/ forecast_describe.htm
NEW QUESTION 60
Which type of sort is applied in the Ship Mode field?
Larger image
- A. Nested Sort
- B. Alphabetic Sort
- C. Field Sort
- D. Data Source Order
Answer: A
Explanation:
Refer to Nested Sort section:
https://help.tableau.com/current/pro/desktop/en-us/sortgroup_sorting_computed_howto.htm
NEW QUESTION 61
Connect to the "Global Superstore" data source and use the Orders table. Find out how many days in the month of May 2012 were profitable?
- A. 0
- B. 1
- C. 2
- D. 3
Answer: B
Explanation:
Graphical user interface, application Description automatically generated
Here we have created the Fixed LOD expression and fixing the order date. If profit is greater than 0 it means profitable day/month/quarter/year depends on what you need to find. If profit < 0 then not profitable.
Drop the Order Date to the rows and drill-down it till months.
Drop the profitable days field to the Text, aggregated as SUM. So it will find a number of days.
Graphical user interface, application Description automatically generated
NEW QUESTION 62
Connect to the "Global Superstore" data source and use the Orders table. Create a hierarchy of Segment, Category, Region. Create a crosstab using this hierarchy and add profit, profit ratio fields. Which of the following are true from the below options?
- A. The overall highest profit ratio is of North Africa region in Technology Category and Corporate segment (among all the segments)
- B. The overall lowest profit ratio is of Central Asia region in Furniture Category and Corporate segment (among all the segments)
- C. The Southern US is having the third-lowest profit ratio in Technology Category in Home Office Segment and it is having a profit value of $765
- D. The Central Africa region is having a profit value of $10,709 in the Office Supplies category in the Corporate Segment
Answer: B,C
Explanation:
Create a hierarchy of Segment, Category, Region and drop it into the rows.
Text Description automatically generated
Create profit ratio calculated field:
Graphical user interface, text Description automatically generated
Drop the profit and profit ratio fields to the view, your view will look like this:
Graphical user interface, text, application Description automatically generated
Now let's go through each answer option.
1) The overall lowest profit ratio is of Central Asia region in Furniture Category and Corporate segment - The profit ratio is -142.26% which is lowest overall so it is true.
2) The Southern US is having the third-lowest profit ratio in Technology Category in Home Office Segment and it is having a profit value of $765 - It is true, the profit ratio is 2.06%, which is third-lowest.
3) The Central Africa region is having a profit value of $10,709 in the Office Supplies category in the Corporate Segment - False, it is having a $2,245 profit.
4) The overall highest profit ratio is of North Africa region in Technology Category and Corporate segment - False Note: This is an easy question but time consuming, so attempt these types of questions in the end.
NEW QUESTION 63
You have connected to an excel sheet that has two tables "orders" and "returns". You need to create a data extract and store it as Multiple Tables. But multiple tables option is greyed out. What is the possible reason for this?
- A. It will only be enabled once you perform the join
- B. It will only be enabled once you perform the union
- C. It will only be enabled once you perform the data blending
- D. It will only be enabled once you save the visualization to Tableau Server
Answer: A
Explanation:
Explanation
Select the Extract connection and click on Edit as shown:
If you have single table on the canvas, then Multiple tables option remain disabled:
If you create a join, only then Multiple tables option will be enabled:
NEW QUESTION 64
Using the Regional Dashboard twbx file, find out the percentage of average obesity increases when 1% average increase in the physical inactivity in the New York state of the Northeast region?
- A. 0.63%
- B. 0.57%
- C. 0.40%
- D. 0.47%
Answer: C
Explanation:
Explanation
Open Regional Dashboard twbx file, and select the region as Northeast and state as New York:
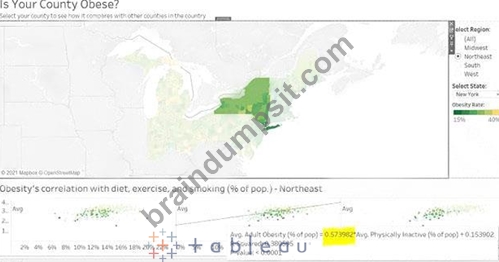
Hover the trend line of Obesity correlation with exercise chart, 0.57 percentage of average obesity increases when 1% average increase in the physical inactivity in theNortheast Region.
However, we have to find out for the New York State. Currently, when you have selected the New York state, the trend lines have not been recalculated.
To recalculate it, right-click on the trend line and click on Edit All Trend Lines:
In Trend Line Options, select the Show recalculated line check box:
Hover the trend line of Obesity correlation with exercise chart, 0.40 percentage of average obesity increases when 1% average increase in the physical inactivity in theNew York Statein the Northeast Region.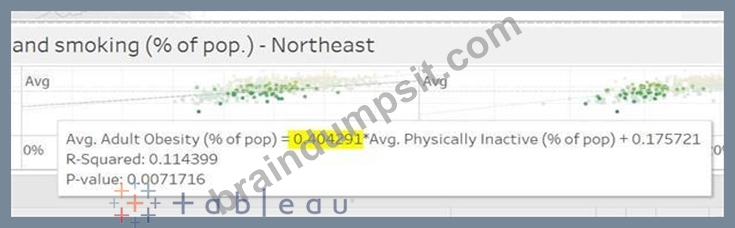
NEW QUESTION 65
How to add reference lines in a view? (Select correct two answers)
- A. Using Analytics pane
- B. Right Click on Axis and Add Reference Line
- C. Using Analysis Menu
- D. Using Data Pane
Answer: A,B
Explanation:
Using Analytics pane:
Graphical user interface, application Description automatically generated
Right Click on Axis and Add Reference Line:
Graphical user interface, application Description automatically generated
NEW QUESTION 66
Connect to the "Education" data source. Analyze the Math score and create 3 categories. If the score is less than 500 then consider the student as 'Low Performer'. If the score is greater than or equal to 500 but less than
600 then call it 'Average Performer'. If the score is greater than or equal to 600 then 'High Performer'. Find out the percentage of Average Performers in males?
- A. 42.84%
- B. 32.25%
- C. 44.33%
- D. 32.38%
Answer: C
Explanation:
Explanation
Create the Calculated field 'Math Performers':
Drop the Math Performer field to the Rows and drop gender to filter, select 'Men' Drop the Number of Records (if tableau version prior to 2020.2) to the Text Or Drop the Education.csv(Count) (tableau version 2020.2 and after) to the Text Apply 'Percent of Total' Quick table calculation to the field on the Text marks card:
NEW QUESTION 67
What are the types of annotations available in Tableau?
- A. Mark
- B. Point
- C. Circle
- D. Area
Answer: A,B,D
Explanation:
Graphical user interface, application, table Description automatically generated
NEW QUESTION 68
Using the Profit Analysis Dashboard twbx file, find out the 5th most profitable product in the state of New York? You can add the functionality to the dashboard.
- A. GBC DocuBind TL300 Electric Binding System
- B. Canon imageCLASS 2200 Advanced Copier
- C. Fellowes PB500 Electric Punch Plastic Comb Binding Machine with Manual Bind
- D. HP Designjet T520 Inkjet Large Format Printer - 24" Color
Answer: A
Explanation:
Select New York State, you are getting only 3 products, and not 5.
Timeline Description automatically generated
You need to add State as a Context filter in the Top 5 profitable products View. For that, go to the Top 5 profitable products sheet. (click on small arrow) Chart, bar chart Description automatically generated
Select Add to Context on the State filter
Graphical user interface, text, application, chat or text message Description automatically generated
A picture containing graphical user interface Description automatically generated
NEW QUESTION 69
Which of the following are valid calculations?
- A. SUM([Profit]) * [Quantity]
- B. MAX(SUM(Profit), (Sales))
- C. SUM([Profit]) * 1000
- D. SUM([Profit]) * SUM([Quantity])
Answer: C,D
Explanation:
You cannot mix the aggregated and non-aggregated calculations.
MAX(SUM(Profit), (Sales)) -> Profit is aggregated but Sales is not.
SUM([Profit]) * [Quantity] -> Profit is aggregated but Quantity is not.
You can multiply the aggregated/non-aggregated fields with constant. That's why SUM([Profit]) * 1000, is correct.
SUM([Profit]) * SUM([Quantity]) - Both are aggregated
NEW QUESTION 70
......
New Desktop-Certified-Associate Exam Questions Real Tableau Dumps: https://www.braindumpsit.com/Desktop-Certified-Associate_real-exam.html